JMeter Integration with Appdynamics
Introduction
One
of the most important tasks in performance testing is to identify the
performance bottlenecks. Performance testing tools like JMeter and Loadrunner
can help you to identify the slow running transactions under a specific load but
may be able not provide the exact root cause of slowness.
In to order perform the root cause analysis of a slow running transaction, we need
an application performance monitoring (APM) tool.
Appdynamics
is one of the most widely used APM tool in the industry. It gives you code level analysis
to identify the specific piece of code or function which is causing slowness in
the application.
We
can integrate JMeter with Appdynamics for one to one mapping of JMeter
transactions and Appdynamics business transactions (BTs) which plays an
important role in root cause analysis (refer below images)
JMeter-Appdynamics Integration
Steps: It
include two steps
1. Add Appdynamics Header in
JMeter Script
2. Create Custom business
transaction rule in Appdynamics.
1.
Add Appdynamics Header in
JMeter
1) Open your JMeter script.
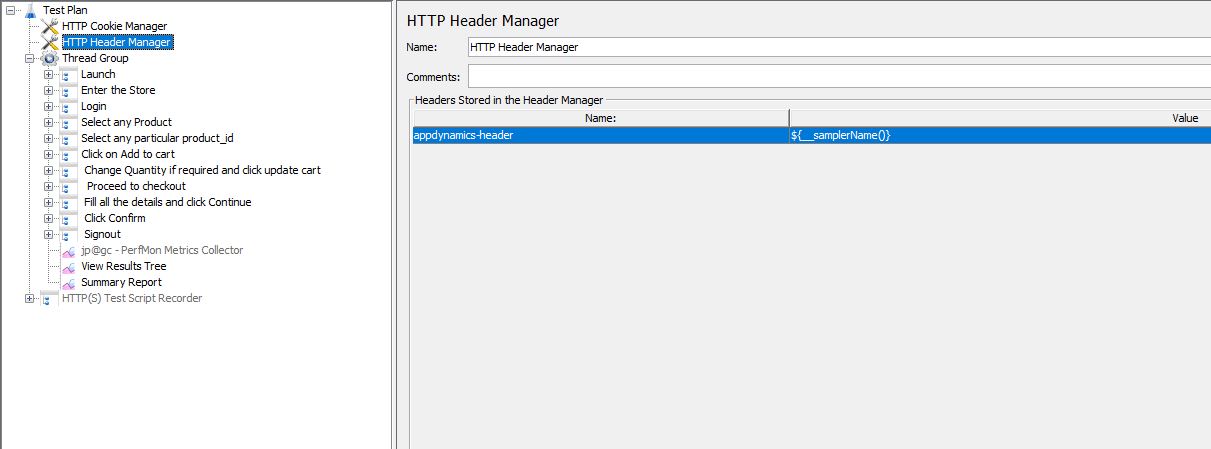
2) Add a “HTTP Header Manager” your
Test Plan (Test Plan->Add->Config Element->HTTP Header Manager)
3) Add below header in “HTTP Header
Manager” (Refer screenshot)
Header Name: appdynamics-header
Header Value: ${__samplerName()}
2.
Create a Custom business
transaction rule in Appdynamics
1) Open your Appdynamics
controller.
3) Click on “Transaction Detection”
Tab.
5) Select the application agent and
entry point type and click on next button.
I am using a JAVA application
build on Servlet and hence I have selected java as agent type and Servlet as
Entry Point Type.
6) Add Name as “JMeter”, Priority
as “10” and Scope as “Default Scope”.
Priority: This field defines
the priority of a rule. If there are multiple rule created with same scope,
the rule with higher priority will be applied first compared to the rule with lower
priority.
Scope: The default value of
this field is “Default Scope”, which means that the rule will be applied to all
the tiers and nodes of the application. We can limit our rule to certain
tiers/nodes/servers by creating a custom scope.
7) Switch to “Rule Configuration” tab. Here we need to give the definition
of our custom rule.
- Set URI value to “Is Not Empty”.
- Add new rule criteria “Header” by clicking on “Add” button.
- Set “Check for Existence” criteria with value “appdynamics-header”
(Same as JMeter header name)
- Expand “Split transaction using request data” section.
- Set “Use a header value”to Header name “appdynamics-header”.
8) Click on “Save” button and you
are done.
You
have finally integrated your JMeter script with Appdynamics and now it’s time
to verify the same.
Run
a JMeter test and check under Business Transactions tab in Addynamics for newly
created transactions. If you have followed all the steps properly, You should
be able to see the business transaction with prefix “JMeter” (Your Rule Name) followed
by JMeter script transaction name.
Ex: if your rule name is “JMeter” and transaction name in your JMeter script is “Home-Page” then your BT name in Appdynamics will be created as “JMeter.Home-Page”
Ex: if your rule name is “JMeter” and transaction name in your JMeter script is “Home-Page” then your BT name in Appdynamics will be created as “JMeter.Home-Page”
How does it works?
·
When you run a JMeter test, JMeter send each request to the server
with header name “appdynamics-header”.
·
Appdynamics continuously run its custom rules and create a new
transaction whenever a request arrives with header name “appdynamics-header”.
·
A new separate business transaction is created for each header
value or request name.
If you are unable to see the
transaction names in Appdynamics. There may be one of the following reasons
·
Header name is JMeter and Appdynamics configuration is not same.
·
Appdynamics agent is not up and running.
·
Sometimes it may take time up to 5 min to reflect newly created
transactions.


Leave a Comment